rico: rich content to HTML as easy as Doc(df, plot)
What is rico? #
rico is a Python package for creating HTML documents from rich content: dataframes, plots, images, markdown, etc. It provides a high-level, easy-to-use API with reasonable defaults, as well as low-level access for better control.
Why rico? #
One might wonder why they need another package if they can create HTML documents with Jupyter and nbconvert. If you are working with data in Jupyter notebooks, you probably don't need rico. But if you are working with data in Python scripts, rico can be helpful.
Here is my use case. I'm working with data in Python scripts and organizing them into data pipelines using Prefect. Sometimes I want to create a report as the last step of a pipeline. With Jupyter I would have the following routine:
- Create a task to save all the dataframes I need for my report in Parquet files or in a database.
- Create a Jupyter notebook to load the dataframes and visualize all the tables and plots I need.
- Create a task to convert the notebook to HTML using nbconvert.
Creating an extra task and an extra notebook is not what bothers me the most. I have to think about how to pass data to a notebook. Sure, it's not a very hard job, but it's not a job I want to spend my time on.
With rico, I simply create a task to add all objects I want to visualize to a document and save it to an HTML file.
How to use rico? #
Installation #
pip install ricorico has no dependencies other than standard Python packages.
For Markdown support install markdown-it-py or Python Markdown or set your own Markdown renderer using rico.set_config.
Basic usage #
rico provides both declarative and imperative interfaces.
Declarative style:
import pandas as pd
import rico
df = pd.(
{
"x": [2, 7, 4, 1, 2, 6, 8, 4, 7],
"y": [1, 9, 2, 8, 3, 7, 4, 6, 5],
},
index=pd.(list("AAABBBCCC")),
)
plot = df.plot.(x="x", y="y")
doc = rico.("Hello, World!", df, plot, title="My doc")The result: Click on image to zoom in.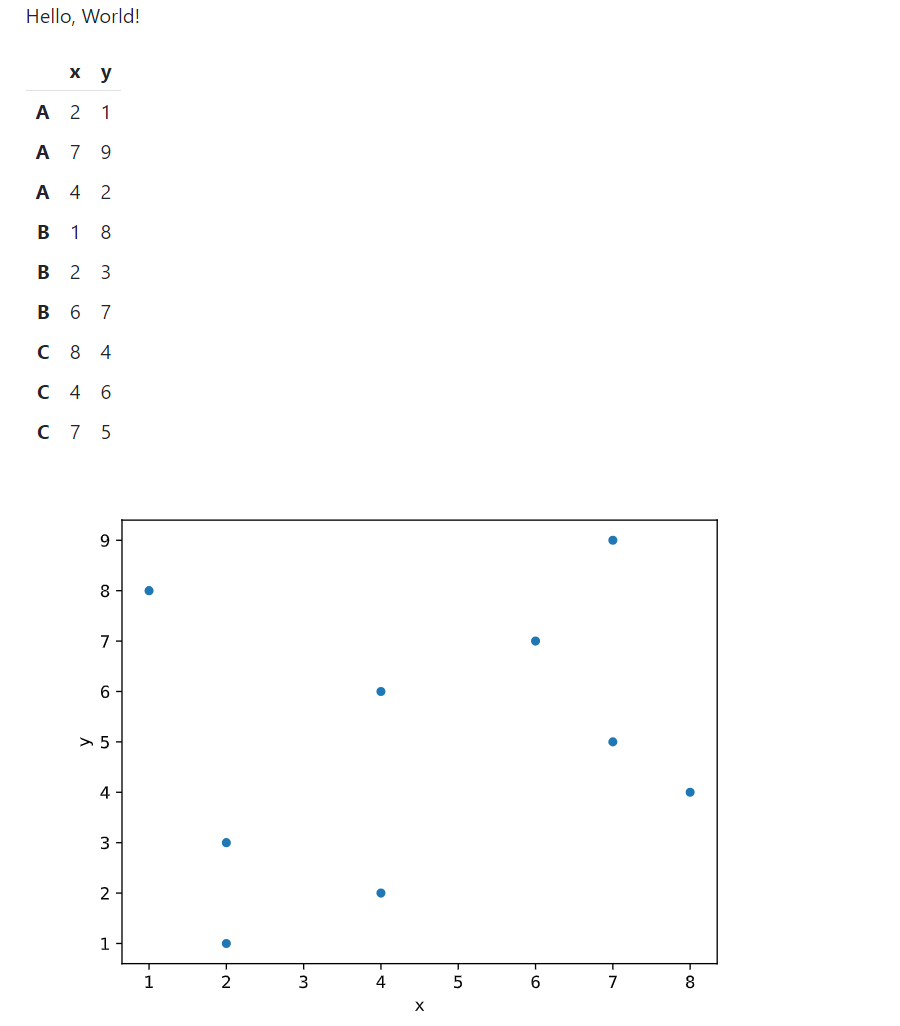
Imperative style:
doc = rico.(title="My doc")
doc.("Hello, World!")
doc.(df, plot)The result will look the same.
Serialize the document to HTML using str(doc):
with open("doc.html", "w") as f:
f.(str(doc))Also, you can call doc.serialize(indent=True) to indent the HTML element tree. For brevity, I will omit the serialization and saving to file in the following examples.
Content types #
rico automatically recognizes the following content types:
- rico content classes (subclasses of
rico.ContentBase). - Matplotlib Pyplot Plots.
- Dataframes, Seaborn plots, Altair charts and other types with IPython rich representation methods. Basically, rico supports the same types as Jupyter.
- Text.
Use specific classes for plots and text to change the default behavior:
doc = rico.(
rico.("Hello, World!", mono=True), # The default value is False.
df,
rico.(plot, format="png", bbox_inches="tight"), # The default value is "svg".
title="My doc",
)The following code gives the same result as the code above:
doc = rico.(title="My doc")
doc.("Hello, World!", mono=True)
doc.(df)
doc.(plot, format="png", bbox_inches="tight")Use specific classes and methods for other content types:
- Images:
ImageorDoc.append_image. - Code:
CodeorDoc.append_code. - Markdown:
MarkdownorDoc.append_markdown. - HTML tag:
TagorDoc.append_tag. - Raw HTML:
HTMLorDoc.append_html.
For example:
doc = rico.(
rico.("## Dataframe"),
df,
rico.("h2", "Plot"), # An alternative way to add a header.
plot,
rico.("<h2>Code</h2>"), # Another way to add a header.
rico.("print('Hello, World!')"),
title="My doc",
)The result: Click on image to zoom in.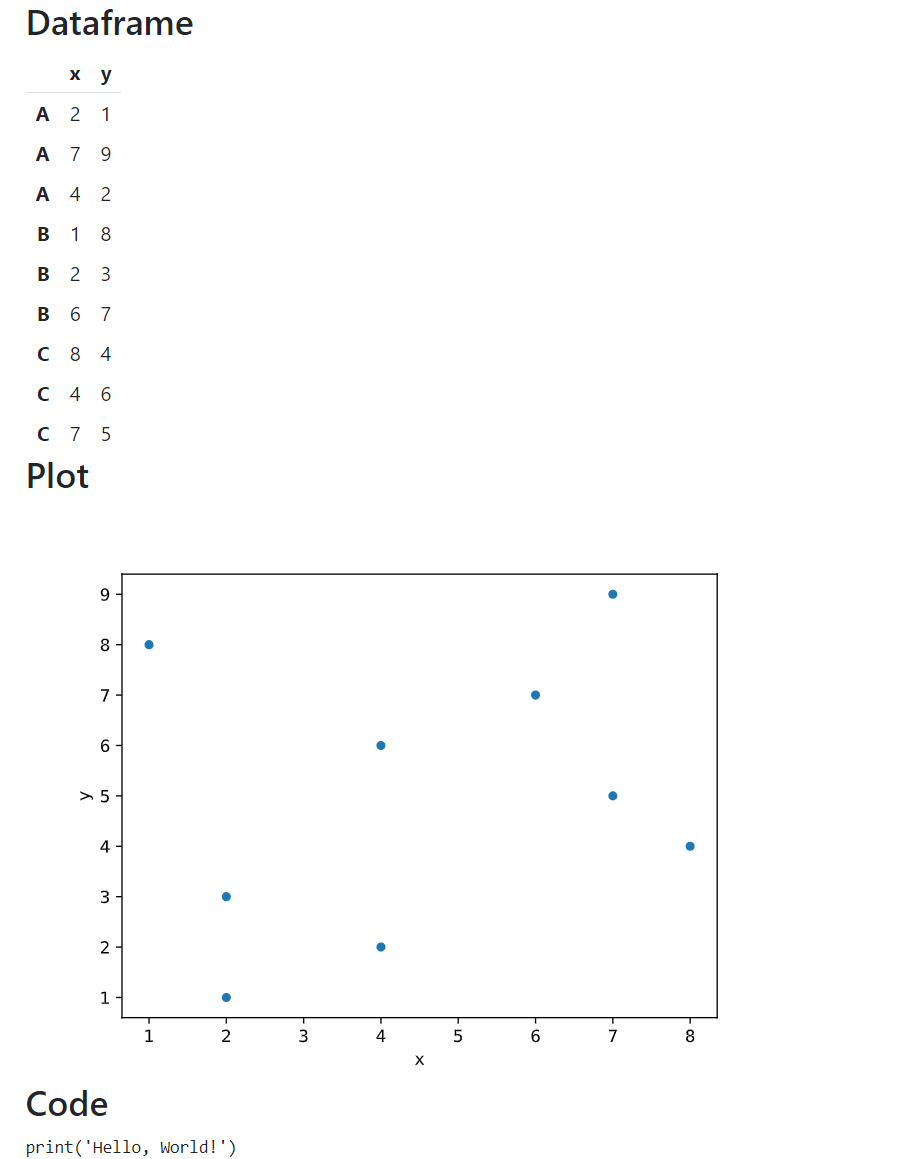
The following code gives the same result as the code above:
doc = rico.(title="My doc")
doc.("## Dataframe")
doc.(df)
doc.("h2", "Plot")
doc.(plot)
doc.("<h2>Code</h2>")
doc.("print('Hello, World!')")Layout #
rico relies on Bootstrap styles. The resulting documents are responsive and mobile-friendly. Use Bootstrap classes to control document layout. For example:
import altair as alt
doc = rico.(
rico.("h2", "Dataframes"),
rico.(
rico.(rico.("h3", "A"), df.loc["A", :], class_="col"),
rico.(rico.("h3", "B"), df.loc["B", :], class_="col"),
rico.(rico.("h3", "C"), df.loc["C", :], class_="col"),
class_="row row-cols-auto",
),
rico.("h2", "Plots"),
rico.(
rico.(
rico.("h3", "A"),
alt.(df.loc["A", :]).().(x="x", y="y"),
class_="col",
),
rico.(
rico.("h3", "B"),
alt.(df.loc["B", :]).().(x="x", y="y"),
class_="col",
),
rico.(
rico.("h3", "C"),
alt.(df.loc["C", :]).().(x="x", y="y"),
class_="col",
),
class_="row row-cols-auto",
),
title="Grid system",
)The result: Click on image to zoom in.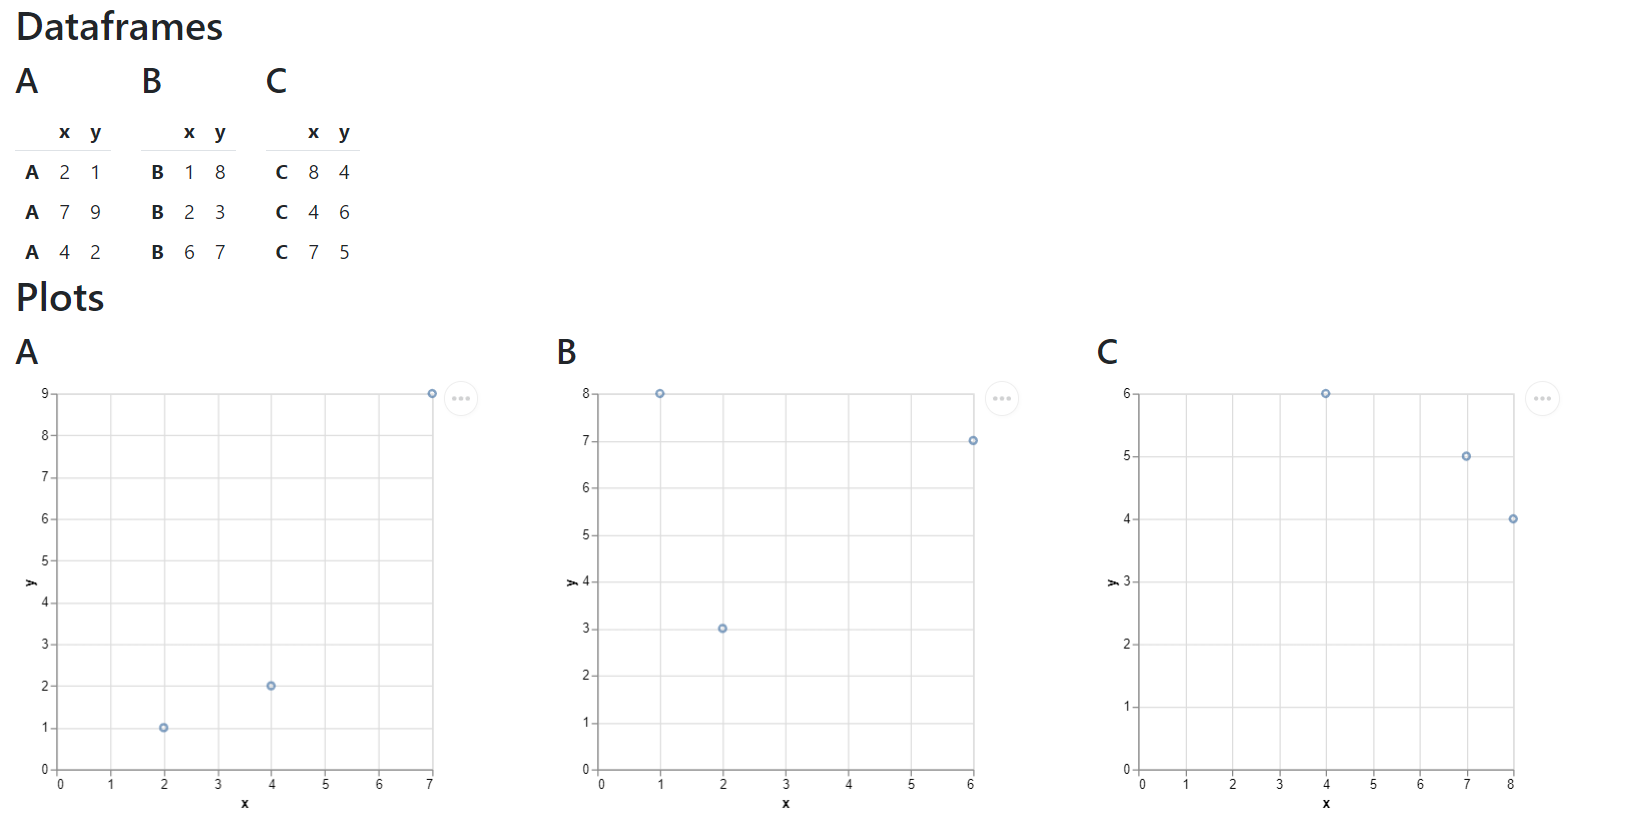
How it works:
rico.Divrepresents an HTML container (<div>). You can add objects to it, just like withrico.Doc.- Each content element is also wrapped in a
<div>container. rico.Objis a magic class that automatically determines the content type, just likerico.Docdoes.- You can specify an HTML
classattribute of a<div>container forrico.Divand for any content element such asrico.Obj. - The
"row","row-cols-auto","col"classes are part of the Bootstrap Grid System. Read more in the documentation.
The following code gives the same result as the code above:
doc = rico.(title="Grid system")
doc.("h2", "Dataframes")
div1 = rico.(class_="row row-cols-auto")
doc.(div1)
for name, data in df.(df.index):
div1.(rico.("h3", name), data, class_="col")
doc.("h2", "Plots")
div2 = rico.(class_="row row-cols-auto")
doc.(div2)
for name, data in df.(df.index):
div2.(
rico.("h3", name),
alt.(data).().(x="x", y="y"),
class_="col",
)More information #
To learn more about how to use rico:
- Read the more detailed user guide.
- Take a look at the self-explanatory examples with resulting HTML documents.
- Install rico, create your own documents.
- Check the docstrings for details.
Feel free to create an issue to report bugs or submit a suggestion.