Debunking the Dunning–Kruger effect with random number simulation
Intro #
Many people associate the Dunning–Kruger effect with the following image: Misinterpretation of the Dunning–Kruger effect
Actually, this image is a misinterpretation of the conclusions drawn by Dunning and Kruger from their experiments. The Dunning–Kruger effect is a cognitive bias in which people with limited competence in a particular domain overestimate their abilities.1
Furthermore, evidence suggests that the Dunning and Kruger experiments might not definitively prove that the effect is real. It can be shown that it's a statistical artifact and the result of the way data is manipulated.2 3 4 I'll illustrate this using a random number simulation, which offers an intuitive and straightforward understanding.
In this post, I'll:
- Provide details of the experiments and analysis conducted by Dunning and Kruger.
- Simulate similar results using random data that do not imply that the effect is real.
- Explain why percentiles are not a suitable measure for these experiments.
I also created a Streamlit app as a demo for this blog post. Feel free to play with it and check out the source code.
Dunning and Kruger experiments5 #
Justin Kruger and David Dunning conducted several experiments (studies), each in one of the domains: humor, logical reasoning, and English grammar. In each experiment, participants—who were Cornell University students—took a test that assessed their knowledge in the domain. After the test, they were asked to assess their ability compared to other Cornell students. To be specific, participants were required to provide percentile rankings on a scale from 0 to 99. In two of the three studies, they were also asked to assess their test performance.
Dunning and Kruger performed the following analyses for each experiment:
- Assigned participants percentile ranks based on their test score, with 0 being the lowest score and 99 being the highest score.
- Calculated the average perceived ability percentile and found out that it exceeded the average test score percentile (50, by definition).
- Grouped participants in quartiles based on their test score.
- Calculated the average test score percentile and the average perceived ability percentile for each test score quartile (see the plot below).
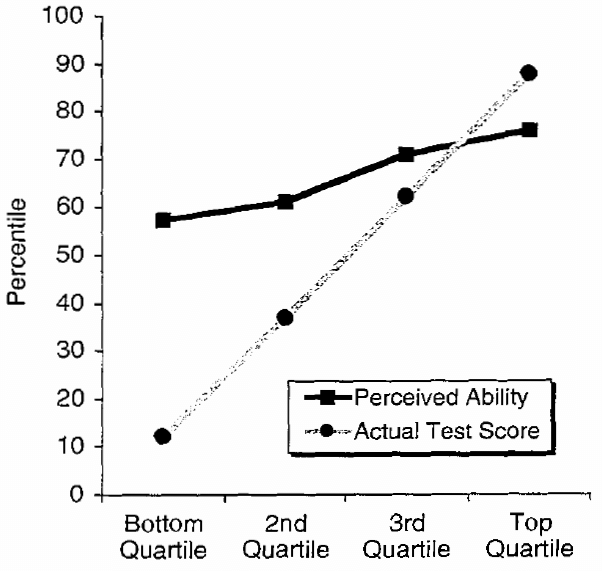
Perceived ability to recognize humor as a function of actual test performance (Study 1)
The plot above compares the average test score percentile and the average perceived ability percentile by test score quartile for the humor study. The plots for logical reasoning and English grammar experiments look similar. They also contain the average perceived test score percentiles that are quite close to the average perceived ability percentiles.
The main conclusions that were drawn:
- Participants overall overestimated their abilities.
- "Incompetent" participants grossly overestimated their ability relative to their peers.
The second conclusion is commonly referred to as the Dunning–Kruger effect. In the rest of the post, I will focus mostly on this conclusion and on the calculations that led to it.
Dunning and Kruger also conducted other experiments that studied participants' abilities to reassess their competence. I omit the details as they are not the main interest of this post.
Random number simulation #
As previously mentioned, these experiments didn't prove the Dunning–Kruger effect. To demonstrate this, I'll:
- Simulate the experiments with random data implying that the effect is not real.
- Perform the same calculations as Dunning and Kruger.
First, let's generate test scores and perceived ability as correlated variables. Each point on the plot below represents a participant with a test score on the x-axis and a perceived ability on the y-axis. Test score vs. perceived ability
Note that the data generation process doesn't imply that "incompetent" participants overestimate their abilities.
Next, we'll compute the percentiles for participants' test scores and perceived abilities. This is not exactly how perceived ability percentiles were obtained in the Dunning and Kruger experiment. But this is still valid for our purpose. Test score percentile vs. perceived ability percentile
Finally, let's calculate the average test score percentile and the average perceived ability percentile by test score quartiles. Average percentiles by test score quartiles
For the bottom quartile, the average perceived ability percentile is higher than the average test score percentile. Feel free to try different values for the random seed, correlation coefficient (below 1), or number of participants in the Streamlit app.
You will always get this result for two variables with imperfect correlation. But Dunning and Kruger used this result as evidence that "incompetent" participants overestimated their abilities. They were wrong, as this result is a statistical artifact and the outcome of the way data is manipulated.
Additionally, let's use the same data to calculate the average test score percentile and the average perceived ability percentile by perceived ability quartiles. Average percentiles by perceived ability quartiles
Participants from the bottom quartile, on average, have the lowest test scores. For them, the average perceived ability percentile is also lower than the average test score percentile. Doesn't this contradict the Dunning–Kruger effect?
Bias and percentile measure #
In fact, Dunning and Kruger did discuss the regression effect due to imperfect correlation between actual and perceived ability. But they argued that the overestimation they observed was more psychological than artifactual. The main argument was that the magnitude of miscalibration among the bottom quartile was larger than that of the top quartile.5
As you may have noticed, in the simulation, participants overall don't overestimate their abilities. This is different from the Dunning and Kruger experiment. I don't think it's possible to generate a dataset with average perceived ability percentile higher than the average test score percentile without implying that "incompetent" participants grossly overestimate their abilities. The reason is that percentile is a measure with bounded support, meaning it has a finite minimum and maximum.
Let's take a participant with a test score which corresponds to the 99th percentile. They cannot overestimate their abilities in percentiles. Participants from the top test score quartile can overestimate their abilities by 24 percentiles maximum and 12 percentiles on average. Participants from the bottom test score quartile can overestimate their abilities by 99 percentiles maximum and 87 percentiles on average.
If participants overall overestimate their abilities, then, with high probability, the magnitude of overestimation will be larger among participants with low test scores. And this is a pure mathematical artifact, not a psychological effect. This reasoning applies to any measure with bounded support, not just percentiles. For example, we would get the same results with test scores as a measure.
So, the actual reason for the Dunning and Kruger observation is a combination of two factors:
- Participants overall overestimated their abilities.
- Percentile is a measure with bounded support.
Also, I encourage you to think about the question: if a person scores the maximum number of points in a test, does this mean that they cannot overestimate their abilities?
Conclusion #
Justin Kruger and David Dunning conducted several experiments and concluded that "incompetent" participants grossly overestimated their ability relative to their peers. This effect is known as the Dunning–Kruger effect.
I reproduced similar results using random number simulation implying that the effect is not real. If participants overall overestimate their abilities, the magnitude of the overestimation among the participants with low scores is explained by the fact that percentile is a measure with bounded support.
The Dunning–Kruger effect, as observed in the original experiments, is a statistical artifact rather than a psychological phenomenon.
I don't argue about whether the Dunning–Kruger effect is real or not. My intent is to show that the original Dunning and Kruger experiments don't prove it.
I created a Streamlit app as a demo for this blog post. Feel free to play with it and check out the source code.
References #
Nuhfer, Edward, Christopher Cogan, Steven Fleisher, Eric Gaze, and Karl Wirth. (2016). Random Number Simulations Reveal How Random Noise Affects the Measurements and Graphical Portrayals of Self-Assessed Competency. Numeracy 9, Iss. 1: Article 4. DOI: http://dx.doi.org/10.5038/1936-4660.9.1.4.
Nuhfer, Edward, Steven Fleisher, Christopher Cogan, Karl Wirth, and Eric Gaze. (2017). How Random Noise and a Graphical Convention Subverted Behavioral Scientists' Explanations of Self-Assessment Data: Numeracy Underlies Better Alternatives. Numeracy 10, Iss. 1 : Article 4. DOI: http://dx.doi.org/10.5038/1936-4660.10.1.4.
Jarry, Jonathan. (2020). The Dunning-Kruger Effect Is Probably Not Real. McGill University, Office for Science and Society. Article: link.
Kruger, J., & Dunning, D. (1999). Unskilled and unaware of it: How difficulties in recognizing one's own incompetence lead to inflated self-assessments. Journal of Personality and Social Psychology, 77(6), 1121–1134. DOI: https://doi.org/10.1037/0022-3514.77.6.1121. Open access: link.